SCIENCE + ART
The AEROKATS program provides students and life-long learners a chance to learn about a multitude of scientific subjects in a hands-on and engaging way. Detailed below is more information on how each subject is showcased in the program.
KITE DYNAMICS
The design and construction of kites and Aeropods, as well as, how well they fly is dictated by several science disciplines including physics, aerodynamics, and math.
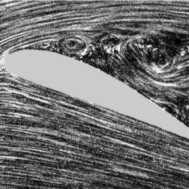
Aerodynamics
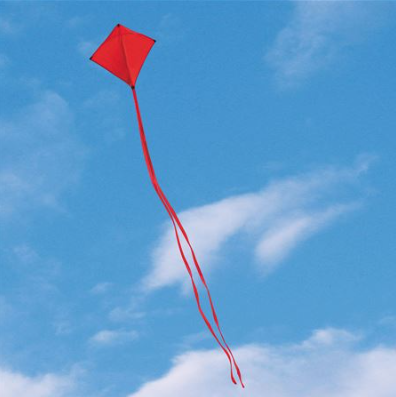
Winds and Turbulence
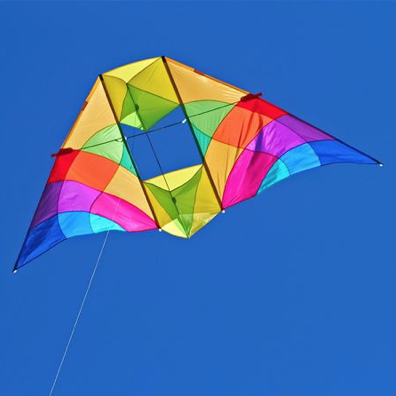
Kite Geometries
REMOTE SENSING
Remote sensing entails the study of the Earth from a higher vantage point. With the aerial perspective we are able to take a closer look at the local environments.
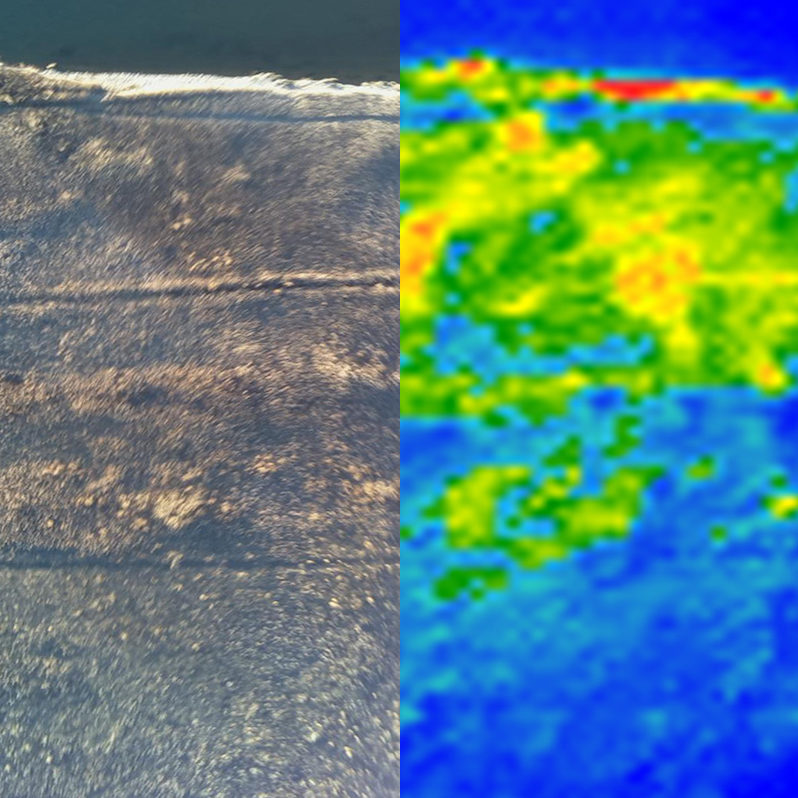
Remote Sensing Big Ideas
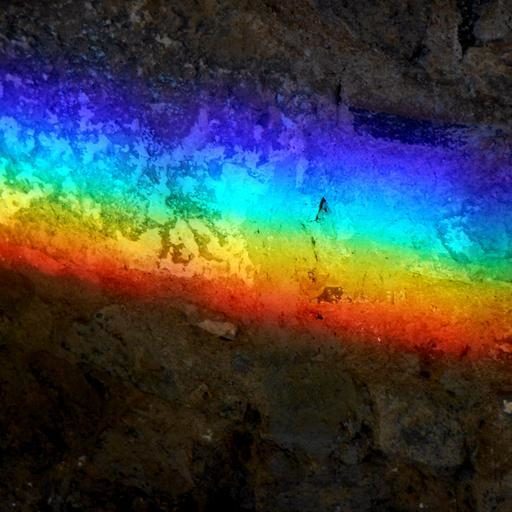
Electromagnetic Spectrum
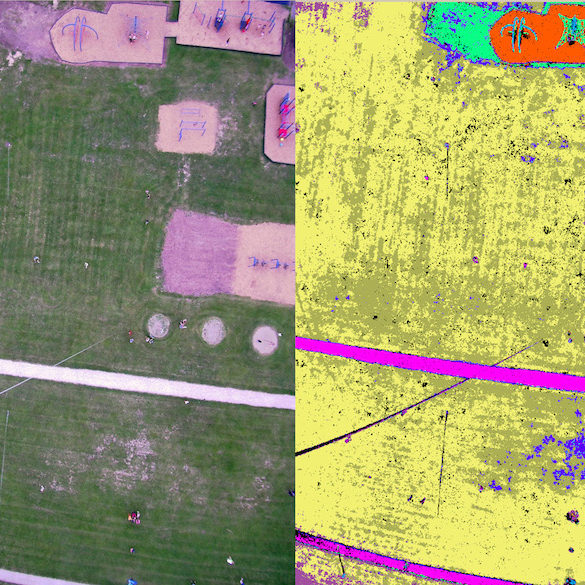
Image Classification
EARTH OBSERVATIONS
Earth observations encompasses the study of all the Earth’s systems. The AEROKATS program is able to utilize remote sensing to study aspects of a more local environment.
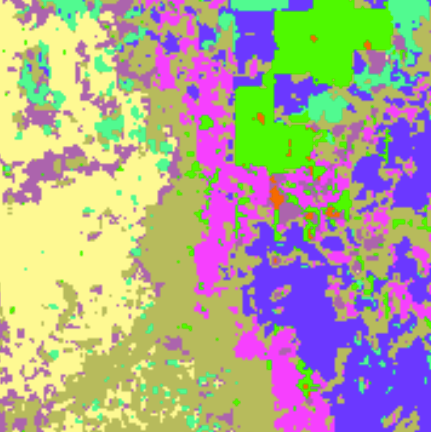
Vegetation Indexing
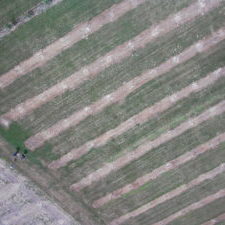
Agriculture
Invasive Species
ATMOSPHERIC SOUNDING
Atmospheric sounding is collected a vertical profile of the atmosphere to study different phenomenon and the meteorological forces that affect the weather.
Concepts and Phenomenon
Atmospheric Monitoring
Boundary Layer
ENGINEERING
Engineering is the science that allows the project to constantly improve and be so versatile, adapting the Aeropod to carry different instrumentation to fit various research needs.
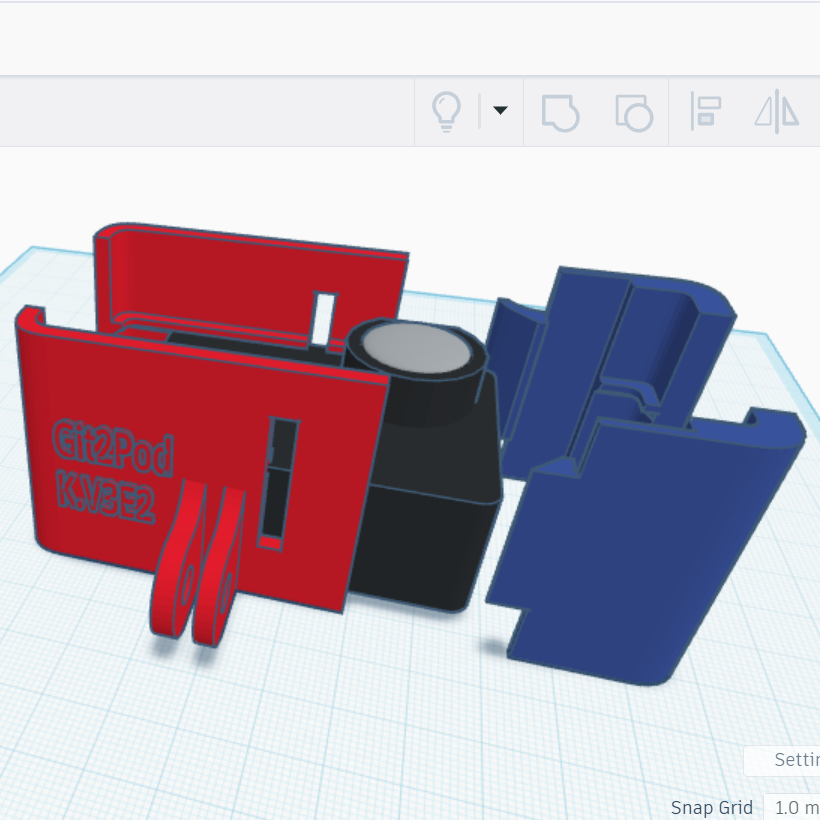
3D Design and Modeling

3D Printing
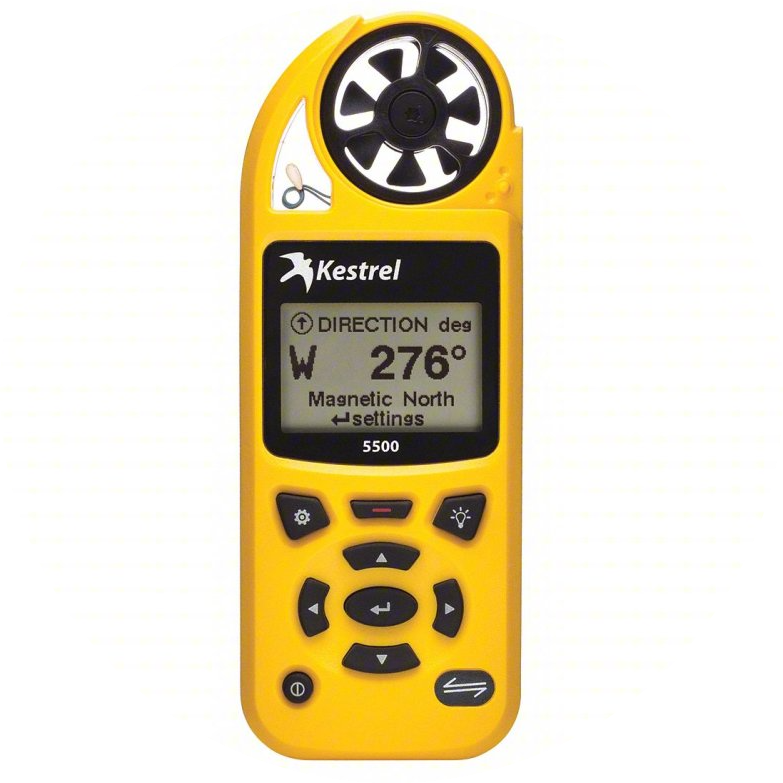
Instrument Testing
HISTORY + ART
Kites have been flown culturally for many centuries and have been flown for data collection as far back as aerial imager has been available from the early 1900’s.

History

Culture

Art
Kite Dynamics
Aerodynamics
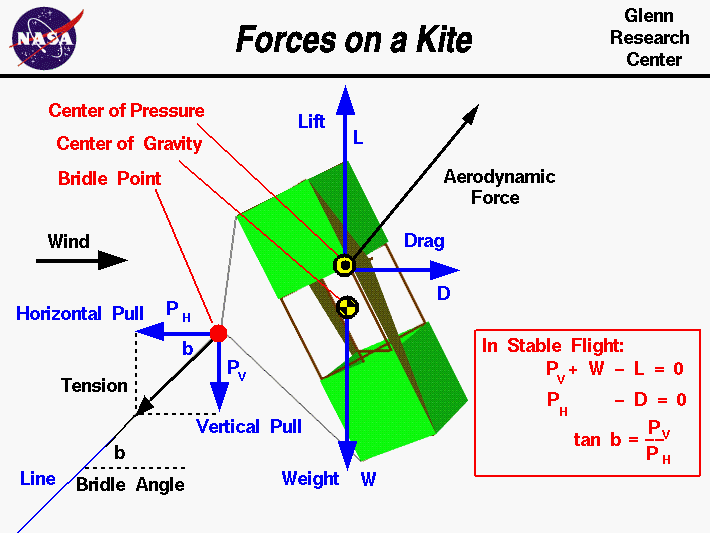
There are four forces that act on a kite in flight:
- Lift- the force that acts in the opposite direction of the ground. It must overcome the weight of the kite and the force of gravity for the kite to fly.
- Drag- the force of wind pushing on the kite. Drag is a type of friction that depends on both the velocity and density of the wind.
- Weight- the force that pulls the kite towards the ground and is made up in part by gravity.
- Pull- the force of tension on the kite line. Pull keeps the kite from being pulled with the wind.
When the kite is in stable flight the forces remain constant and there is no net external force acting on the kite, from Newton’s first law of motion. In the vertical direction, the sum of the forces is zero. So, the vertical pull plus the weight minus the lift is equal to zero.
Pv + W – L = 0
In the horizontal direction, the sum of the horizontal pull and the drag must also equal zero.
Ph – D = 0
Wind and Turbulence
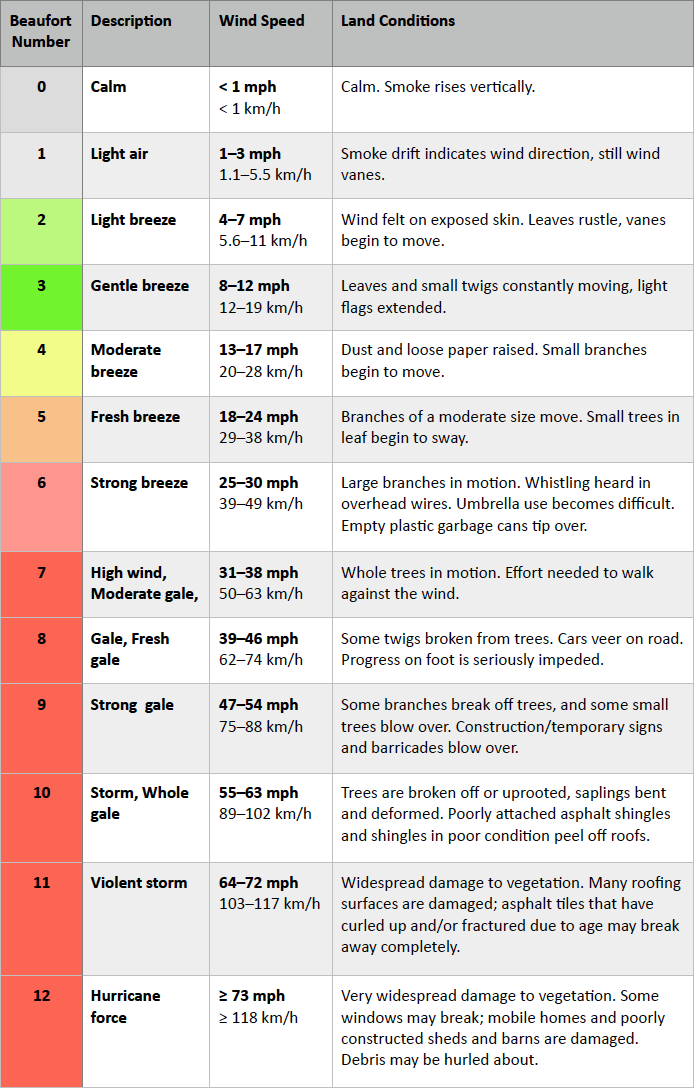
Wind is the flow of air on a large scale caused by differences in atmospheric pressure. It’s characterized in meteorology by velocity and density. When a difference in atmospheric pressure exists, air moves from the higher to the lower pressure area, resulting in winds of various speeds. Wind occurs on a range of scales, from thunderstorm flows lasting tens of minutes, to local breezes generated by heating of land surfaces and lasting a few hours, to global winds resulting from the difference in absorption of solar energy between the climate zones on Earth. The two main causes of large-scale atmospheric circulation are the differential heating between the equator and the poles, and the rotation of the planet (Coriolis effect). One way to characterize wind speeds is with the Beaufort Scale that associates wind ranges with the effect on the local land condition.
Air turbulence is when bodies of air moving at widely different speeds meet and there are several different phenomenon that cause it. Mechanical turbulence is cause when friction between the air and the ground, especially irregular terrain and man-made obstacles, cause eddies. The intensity of this eddy motion depends on the strength of the surface wind, the nature of the surface and the stability of the air. The stronger the wind speed, the rougher the terrain and the more unstable the air, the greater the turbulence. In strong winds, even hangars and large buildings cause eddies that can be carried some distance downwind.Appropriate wind conditions are crucial for successful kite flying. Most kites come labeled with an ideal wind range that is safe and appropriate for that specific kite. Flying in speeds under the ideal wind range means the kite will not be able to generate enough lift to fly, and above the wind range the kite will fly erratically and can become dangerous to the flyer.
Thermal Turbulence can be expected on warm summer days when the sun heats the earth’s surface unevenly. Certain surfaces, such as barren ground, rocky and sandy areas, are heated more rapidly than are grass covered fields and much more rapidly than is water. Isolated convective currents are therefore set in motion with warm air rising and cooler air descending, which are responsible for bumpy conditions as an airplane flies in and out of them. Thermal turbulence extends from the base to the top of the convection layer, with smooth conditions found above.
Frontal Turbulence is the lifting of the warm air by the sloping frontal surface and friction between the two opposing air masses in the frontal zone. This turbulence is most marked when the warm air is moist and unstable and will be extremely severe if thunderstorms develop. Turbulence is more commonly associated with cold fronts but can be present, to a lesser degree, in a warm front as well.
Lastly, Wind Shear is the change in wind direction and/or wind speed over a specific horizontal or vertical distance. Atmospheric conditions where wind shear exists include: areas of temperature inversions, along troughs and lows, and around jet stream. When the change in wind speed and direction is pronounced, quite severe turbulence can be expected. Temperature inversions are zones with vertical wind shear potential. Strong stability prevents mixing of the stable low layer with the warmer layer above. The greatest shear, and thus the greatest turbulence, is found at the tops of the inversion layer. Turbulence associated with temperature inversions often occur due to radiational cooling, which is nighttime cooling of the Earth’s surface, creating a surface-based inversion.
Kite Geometries
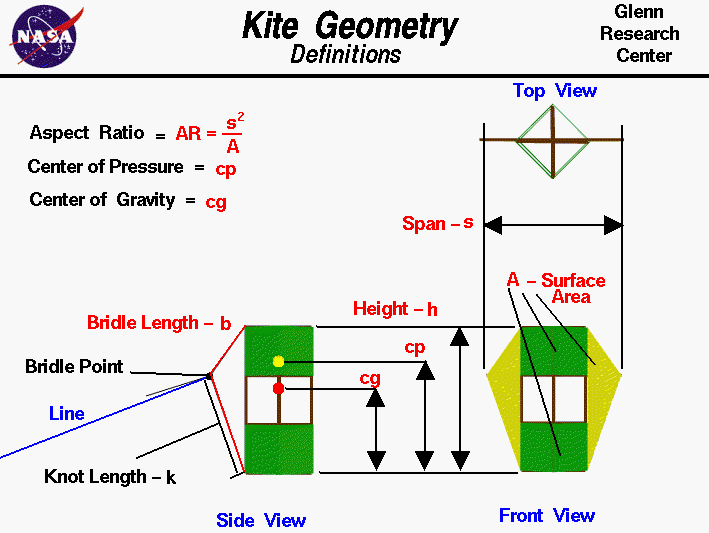
The image above shows a three view diagram of a winged box kite. Beginning with the Front View, we note that the surface area-A which is used in the calculation of lift and drag is the frontal projected area of all of the surfaces of the kite. You learn how to compute the area of various shaped objects in middle school. For this winged box kite, the frontal projected area includes the full area of both wings (colored yellow) and the projected area of the top and bottom boxes (colored green). Notice that this is a projected area, not a geometric area. If each panel of the box kite is a square, there are four panels on the top and four on the bottom to form the two boxes.
From the Top View, we see that each panel is inclined to the front at a 45 degree angle. Then the projected area Ap of each panel is equal to the geometric area Ag times the cosine cos of 45 degrees:
Ap = Ag * cos(45 degrees) = .707 * Ag
If the geometric area is slanted to the front then the frontal projected area is always less than the geomtric area. The top and front view also help us define the span-s of the kite. The span is the widest distance from side to side. It is the same as thewing span of an airplane, the distance from one wing tip to the other wing tip. The ratio of the square of the span to the area A is called the Aspect Ratio AR of the kite.
AR = s^2 / A
This parameter is very important in the determination of lift and drag of the kite. Airplane wings typically have a very long span and have a high aspect ratio. Kites on the other hand usually have a small span and are low aspect ratio aircraft. High aspect ratio aircraft have a higher lift to drag ratio than a low aspect ratio aircraft and are more aerodynamically efficient.
The Side View helps us locate the center of gravity-cg and the center of pressure-cp of the kite. The center of gravity is the average location of the weight of the kite, and the weight force acts through this point. Similarly, the center of pressure is the average location of the aerodynamic forces on the kite, and the lift and drag act through this point. There are techniques to determine the weight, cg, and cp which are described on separate pages. On the front of the kite (to the left in this side view) we attach a bridle string. The bridle length-b is the length of the string from one end attached to the top to the other end attached to the bottom of our kite. It is always longer than the height-h of the kite, so there is some slack in this string. A knot is used to attach the control line to the bridle at a spot called the bridle point. The knot length-k is the distance from the bottom to the knot along the bridle string. The knot length and the bridle length determine the location of the bridle point. In flight, the kite rotates about the bridle point. A kite’s stability is determined by the magnitude of the forces and the distance of the cg and cp from the bridle point.
Remote Sensing
Remote Sensing Big Ideas
Remote Sensing is the observation of a phenomenon from a distance. Typically remote sensing refers to collecting data about the Earth from a satellite or aircraft, but in this case remote sensing can also be achieved using kites. There are two types of remote sensing: active and passive. Active is when an instrument emits a signal that is then measured as it is reflected back off the Earth like radar, whereas, passive remote sensing is where an instrument collects a signal that is reflected off the Earth like sunlight. Remote sensing allows us to learn a great deal of information about the Earth detailed in the sections below.
Electromagnetic Spectrum
The electromagnetic spectrum is the full range of electromagnetic radiation and their wavelengths. All the various forms of radiation are present in the world around us, however only the visible light region of the spectrum is detectable by the human eye and the different wavelengths are seen as the colors of the rainbow. Some regions of the spectrum are more commonly known than others; radio waves are used to transmit songs and shows over the radio, microwaves are used to vibrate the water molecules in food and heat it up, UV or ultraviolet waves radiate from the sun and can cause damage to a person’s skin and eyes, and X-rays are used often in the medical field to see a person’s bones through their skin.
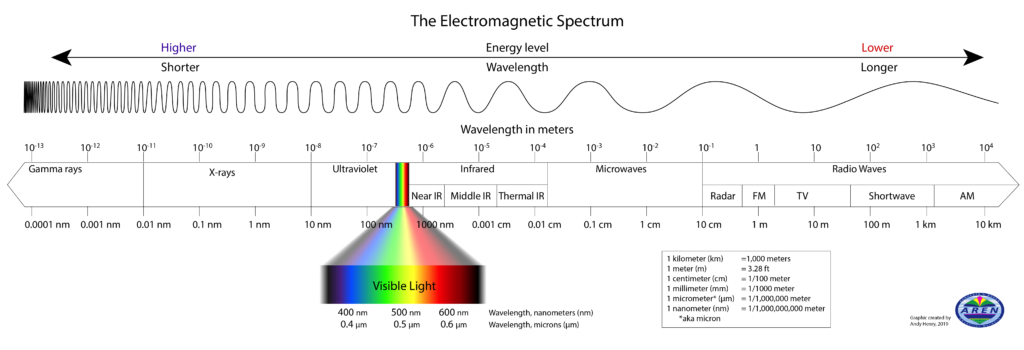
When these forms of electromagnetic radiation interact with matter and transfer energy, it’s called absorption. Different types of matter absorb energy in unique ways and have distinct absorption spectra. One way to measure this is through the energy that is not absorbed, but is instead reflected. The color of objects that we see with our eyes is the energy that is reflected instead of absorbed. The following image depicts examples of spectral reflectance that show how much energy is reflected by the various materials in wavelengths ranging from visible light to middle infrared.
Note the reflectance signature of healthy vegetation (Grass and Deciduous Leafy Trees). It shows that vegetation reflects poorly in blue and red light, better in the green and yellow region of the visible range, and reflects much more strongly in the Near-Infrared (NIR). This signature is very distinctive and can be used to help monitor vegetation health and productivity.

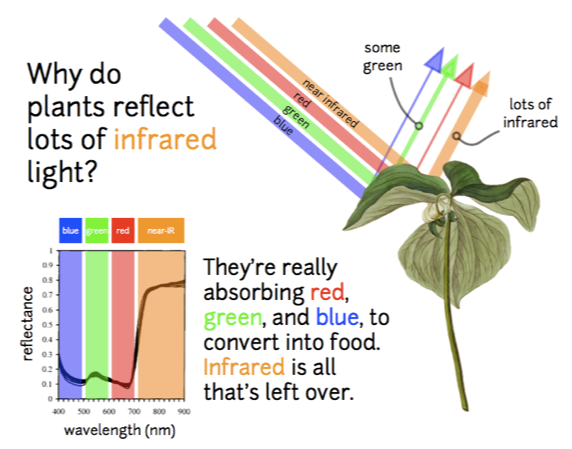 One way this is applied is in the study of plants. During photosynthesis, plants absorb and reflect colors in different quantities. Red and blue are mostly absorbed and used in food production, whereas the green is only partially absorbed and almost no near-IR light is absorbed. The higher reflectance of green compared to blue and red is why plants appear green to the human eye. Similarly, because near-IR is almost entirely reflected by vegetation, plants appear bright white when viewed through an infrared filter. This phenomenon makes it possible to observe and study plants using near-IR cameras like the ones on the TwinCam Aeropod.
Image Processing - Creating Information from Image Data
Aerial Image Interpretation (Photogrammetry)
Using aerial images to understand features on the ground goes back to the earliest usage of kites and balloons to carry cameras. Today aircraft and satellites collect imagery that is use to monitor everything from urban sprawl to troop to military installations and troop movements. Modern AI is increasingly being used to analyze images, but human interpretation is still needed for many applications. Learning how to interpret aerial and satellite images is both an art and a science.
A standard set of visual tools can be used when trying to understand what we are looking at in aerial images. This set is called the Elements of Image Interpretation. Like the scientific method, it has different flavors, but usually involves trying to identify the features in an image by utilizing the following clues:
- Size
- Shape
- Tone and color
- Pattern
- Texture
- Shadow
- Association (What is it with that may give a clue – i.e., tennis courts, ball fields and big parking lots may help indicate that a building is a school)
- Site and Situation (General information about the location that may help determine what the feature is.)
Manual Image Classification
Image classification is the differentiation of an area of earths surface into different types of land cover, such as grass, road, trees, etc. Image classification is used to quantify the types of features in an image and create statistics that can be used for a variety of purposes.
Click on the button below to download a PDF file with a classroom learning activity for manual image classification.
Computer Aided Image Classification
Traditionally classification images were created done manually using a pixel-based technique. Scientists would visually identify areas of different color, texture pattern, and shading to differentiate the land cover types, but this process could be tedious and time consuming. Today there exist software tools for conducting pixel-based image classification and are broken into two types, supervised and unsupervised classification. Supervised classification allows the user to guide the classification by selecting training fields or areas that are good representations of a specific land cover type. The software then uses those training fields to find similar pixels, calculates the probability that it belongs to one of the predefined land cover types, and classifies it. In the unsupervised software the user does not assign training fields but has the option to designate a number of different land cover types, otherwise the algorithm determines through statistical analysis how many types exist and what areas of the image belong to each type.
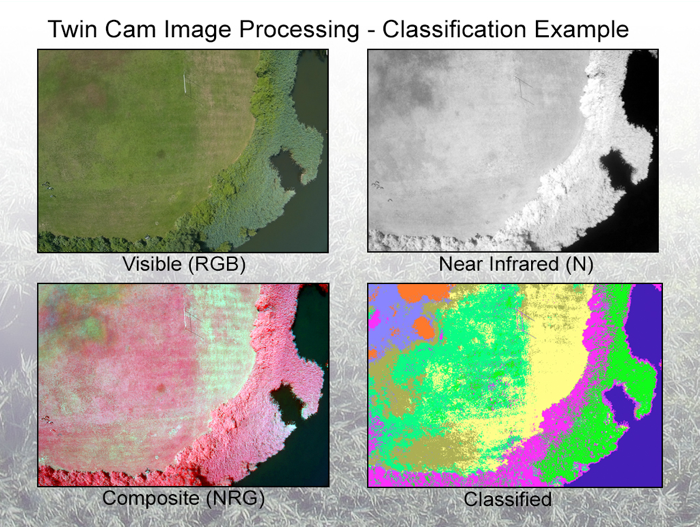
In the AREOKATS program, we are able to perform image classification with the images captured form the TwinCam that mounts a color camera side by side with a near- IR camera. The cameras are arranged together in order to capture near simultaneous images of the same study area. With a RGB (red green blue) color image and a near-IR image we can learn a lot about vegetation because of the unique nature in which light interacts with plants. By replacing either the red or blue band in the RGB image with the near-IR imagewe create a composite image. That image can be further processed in image software, like MultiSpec, to create calssified images that detail different vegetation types. The following image shows an example of a classified image where the different plant types and differentiated from each other as well as differentiated from the water and the dirt patches seen in the RGB image. Classification images provide valuable information about vegetation with applications in the field of agriculture and invasive species monitoring and mitigation.
Structure From Motion
Structure from motion is a technique to combine a series of 2D images into a 3D image. A collection of pictures must be taken with substantial overlap across the images, as well as good resolution. Similar to the way we have to move around in order to comprehend the distance and shape of an object with our eyes, it is also necessary to have pictures taken from many angles for structure from motion (SfM) software to learn about 3D objects. SfM software first identifies areas of commonality between pictures using a feature detector and then creates a dense point cloud that can be masked over to create a 3 dimensional image.
Earth Observations
Vegetation Indexing
A vegetation index is a single number that qualifies an aspect of vegetation such as plant health, biomass, for each pixel of an image. The most common vegetation index is NDVI that measures the presence of vegetation. NDVI is the normalized difference vegetative index and is defined as (NIR – Red)/(NIR + Red). Each pixel in an image is made of a combination of red, green, and blue light in different quantities. Healthy vegetation contains a lot of chlorophyll that reflects back both near-infrared and green light and absorbs both blue and red in high amounts. Because near-infrared is not visible to the human eye, the predominate color reflected by plants is green and that’s why they appear green. In order to calculate NDVI values, the quantities of near- infrared light and red light for reach pixel in an image are plugged into the above formula producing NDVI values that range from -1 to 1. When there is a high amount of near-infrared and a low amount of red light, the NDVI value will be closer to 1, meaning there is a lot of healthy vegetation present.

Agriculture
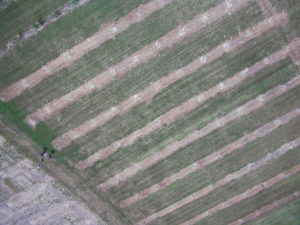 In recent years, the field of agriculture has begun to take advantage of remote sensing technology to increase crop yields with a practice known as precision agriculture. Precision agriculture is the application of precise amounts of water, fertilizer, pesticides, etc. at the correct time to the crop for increasing its productivity and maximizing its yields. NDVI is one metric that is utilized as a means of accessing crop health and help pinpoint areas that require extra watering or nutrients. The aerial perspective in agriculture is useful in a variety of other ways, in particular, for larger farms. Remote sensing allows farmers to better calculate crop acreage, identification of pests and disease infestation, crop yield predictions, flood mapping, and soil moisture. These advancements allow for data to be capture on a larger geographic scale as well as a smaller time scale so that changes can be made to improve the current crop. The data is also valuable for maintaining a high quality farm record as well as improving future decision making.
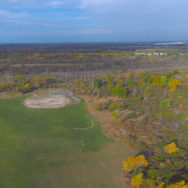
Invasive Species
Invasive species are plants or animals that are not native to a particular area but are introduced purposefully or accidentally. Invasive species are well suited to the new environments and grow rapidly, consuming and depleting the area’s natural resources that other native species rely on to survive. Through this process invasive species disrupt the local ecosystem and do significant damage to the native species that they directly compete with for resources as well as any plant or animal that relies on the native species for survival. For this reason there are many environmental groups that have an interest in monitoring invasive species for scientific research and mitigation.
Atmospheric Sounding
Concepts and Phenomenon
Atmospheric Structure and Trends
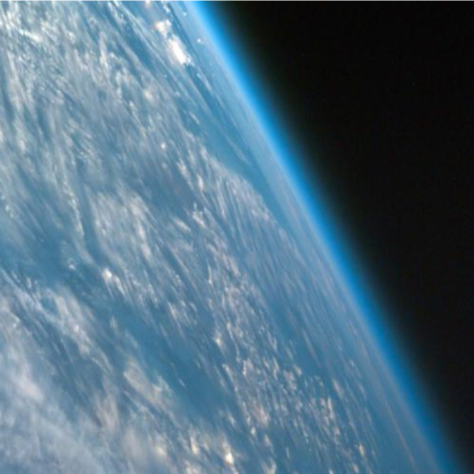
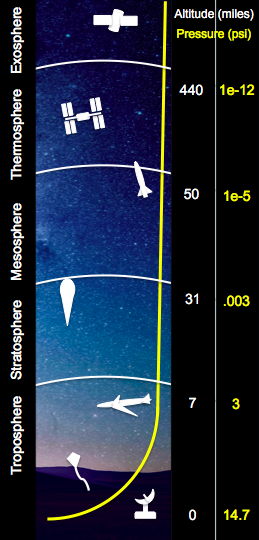 The Earth’s atmosphere is an extremely thin sheet of air extending from the surface of the Earth to the edge of space. The Earth is a sphere with a roughly 8000 mile diameter; the thickness of the atmosphere is about 60 miles. If the Earth were the size of a basketball, the thickness of the atmosphere could be modeled by a thin sheet of plastic wrapped around the ball!
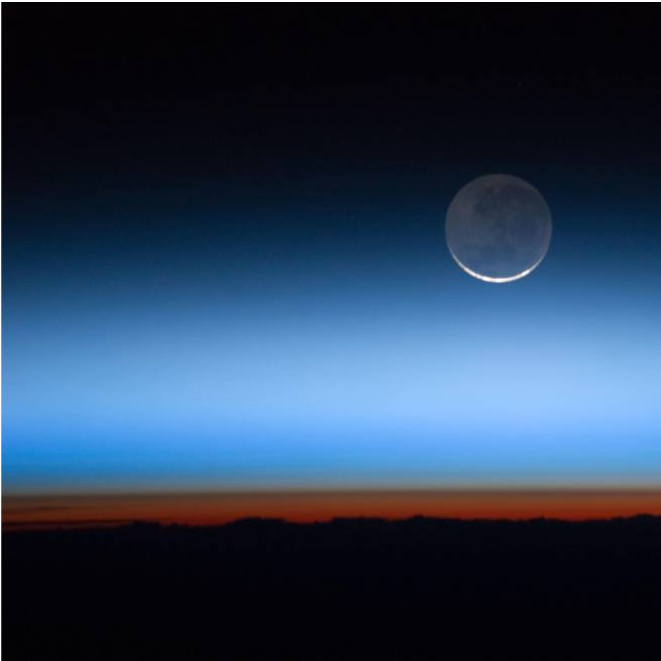
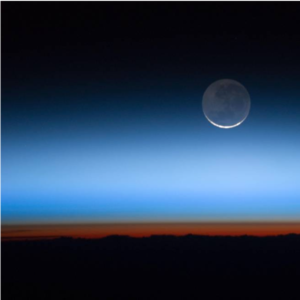
The atmosphere is divided into distinct layers. The image below captures the Thermosphere as an orange-red band over the Earth and the Stratosphere and beyond as a progression of orange to blue. The most relevant of the layers is the Troposphere because it is the closest to the Earth and holds the breathable oxygen. However, the outer layers of the atmosphere are important for other reasons. The Stratosphere houses the ozone layer which blocks the more dangerous UV-B and UV-C radiation from the sun from reaching the earth. The Mesosphere protects the Earth by burning up small objects and meteor before they can impact Earth’s surface. Similar to the Stratosphere, the Thermosphere and Ionosphere absorb harmful solar radiation like X-rays. Certain portions of the Ionosphere can also bounce radio waves back down to the Earth, allowing for long distance radio transmissions.
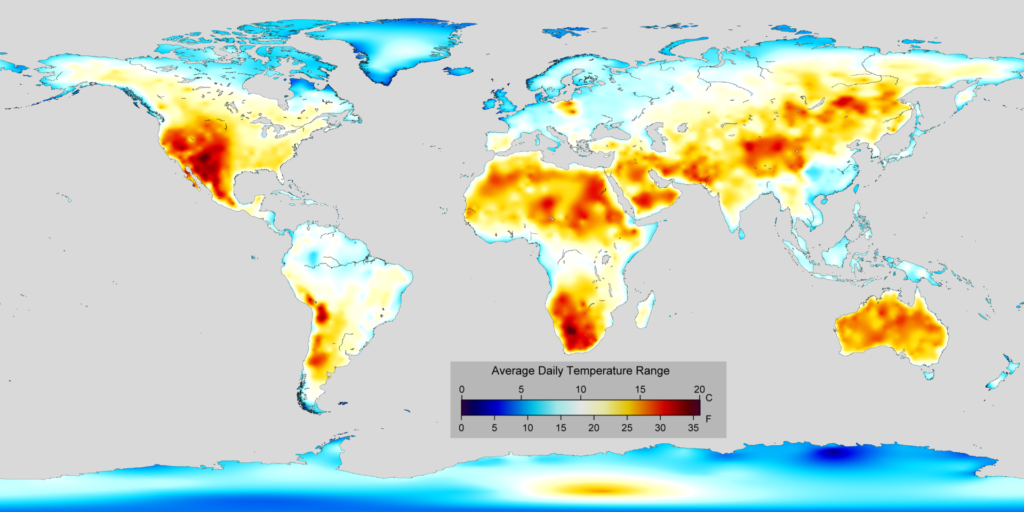
In addition to being closest to the Earth’s surface, the Troposphere is where weather occurs. The unequal heating of the Earth’s surface drives air and ocean circulation and causes climate to vary by latitude. Air and water circulation is initiated at the equator, where insolation is greatest. Masses of air and ocean transport heat energy from areas of high concentration to low concentration. The movement of these masses of air and ocean establish an equilibrium state of heat distribution which we determine the general climate bands, or zones that we see at different latitudes.
 Atmospheric properties are not uniform; fluid properties are constantly changing with time and location. We call this change the weather. The atmosphere’s properties and the weather it generates affect all parts of the Earth, these interactions characterize the Earth system. The Earth system behaves as a single, self-regulating closed system comprising physical, chemical, biological and human components.
At present, what is known of atmospheric science is generated from larger scale models and trends, in large part conducted on airplanes traveling hundreds of miles per hour. Because of the imprecise collection method, the science to some degree is aggregated and generalized and misses the more minute details. The goal of the AREOKATS program is to study the troposphere on a smaller scale to better understand the localized trends of climate and weather.
In-situ measurements
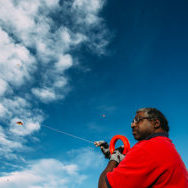
In-situ measurements are measurements taken within the environment being studied, in contrast to remote sensing data where information about the object of research is gathers from afar. Within atmospheric sciences, in-situ measurements can be taken with towers, tethered balloons, surface level platforms. etc. The AEROKATS Profiler provides the ability to take in-situ measurements at higher altitudes than traditional in-situ platforms. For example, it’s possible to capture data about wind speed, temperature, humidity, and a variety of other readings from hundreds of feet in the atmosphere. In-situ data collection provides a more localized look at weather patterns and phenomenon described in this section.
Atmospheric Sounding
Aerosols
 Aerosols are minute particles suspended in the atmosphere. When these particles are sufficiently large, we notice their presence as they scatter and absorb sunlight. Their scattering of sunlight can reduce visibility (haze) and redden sunrises and sunsets. Aerosols interact both directly and indirectly with the Earth’s radiation budget and climate. As a direct effect, the aerosols scatter sunlight directly back into space. As an indirect effect, aerosols in the lower atmosphere can modify the size of cloud particles, changing how the clouds reflect and absorb sunlight, thereby affecting the Earth’s energy budget.
Aerosols also can act as sites for chemical reactions to take place (heterogeneous chemistry). The most significant of these reactions are those that lead to the destruction of stratospheric ozone. During winter in the polar regions, aerosols grow to form polar stratospheric clouds. The large surface areas of these cloud particles provide sites for chemical reactions to take place. These reactions lead to the formation of large amounts of reactive chlorine and, ultimately, to the destruction of ozone in the stratosphere. Evidence now exists that shows similar changes in stratospheric ozone concentrations occur after major volcanic eruptions, like Mt. Pinatubo in 1991, where tons of volcanic aerosols are blown into the atmosphere.
The following images are from the Verex mission over the Big Island, HI where SO2 and CO2 sensors were flown using kites near volcanic craters to measure aerosol levels and validate current volcano models.
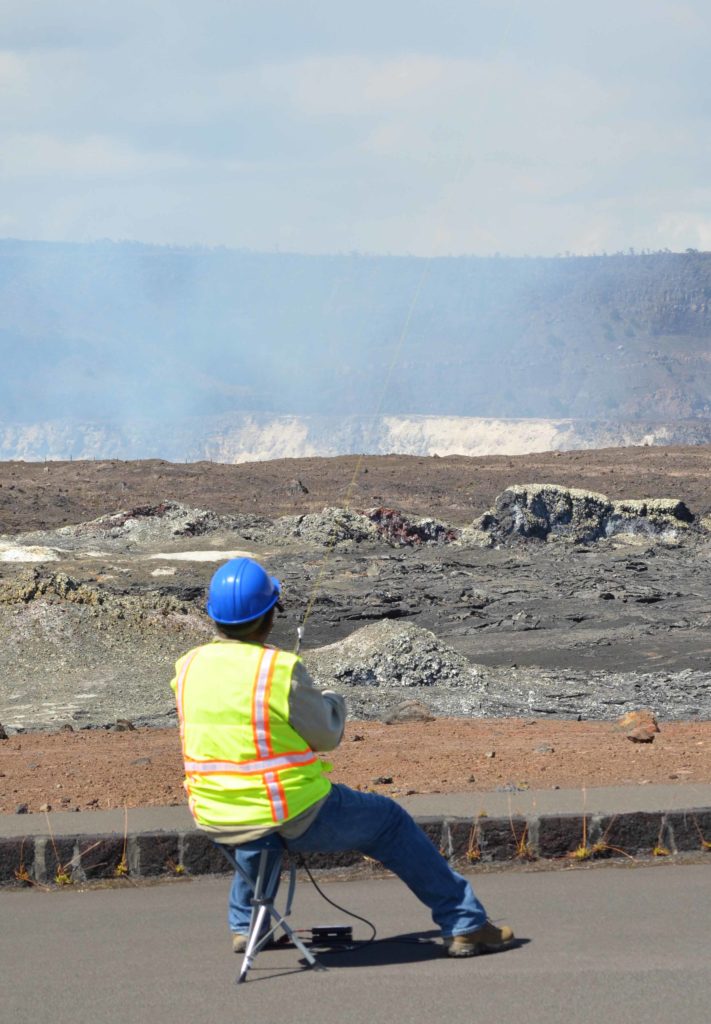 Three types of aerosols significantly affect the Earth’s climate. The first is the volcanic aerosol layer which forms in the stratosphere after major volcanic eruptions like Mt. Pinatubo. Winds in the stratosphere spread the aerosols until they practically cover the globe. Once formed, these aerosols stay in the stratosphere for about two years. They reflect sunlight, reducing the amount of energy reaching the lower atmosphere and the Earth’s surface, cooling them.
The second type of aerosol that may have a significant effect on climate is desert dust. Pictures from weather satellites often reveal dust veils streaming out over the Atlantic Ocean from the deserts of North Africa. Because the dust is composed of minerals, the particles absorb sunlight as well as scatter it. Through absorption of sunlight, the dust particles warm the layer of the atmosphere where they reside. This warmer air is believed to inhibit the formation of storm clouds. Through the suppression of storm clouds and their consequent rain, the dust veil is believed to further desert expansion.
The third type of aerosol comes from human activities. While a large fraction of human-made aerosols come in the form of smoke from burning tropical forests, the major component comes in the form of sulfate aerosols created by the burning of coal and oil. The concentration of human-made sulfate aerosols in the atmosphere has grown rapidly since the start of the industrial revolution. The sulfate aerosols absorb no sunlight but they reflect it, thereby reducing the amount of sunlight reaching the Earth’s surface. Sulfate aerosols are believed to survive in the atmosphere for about 3-5 days. The sulfate aerosols also enter clouds where they cause the number of cloud droplets to increase but make the droplet sizes smaller. The net effect is to make the clouds reflect more sunlight than they would without the presence of the sulfate aerosols.
Particles
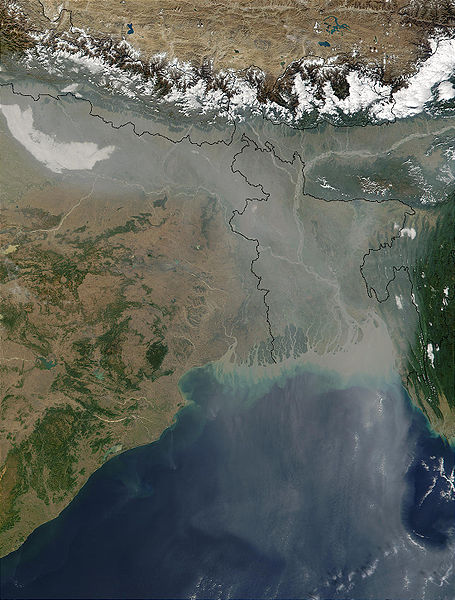 Particles and aerosols are closely related. Particles are microscopic solid or liquid matter in the Earth’s atmosphere, and aerosols, in contrast, are the mixture of particulate and air. Particles are most often differentiated by size, where smaller sizes are more harmful to humans. Most notably, PM10 and PM 2.5 are specific size classes of particulate with PM10 being between 10 and 2.5 micrometers and PM2.5 being 2.5 micrometers or less. Particles are considered a carcinogen and the deadliest pollution because they are able to enter a person’s lungs and blood and cause gene mutation, respiratory issues, and cardiovascular issues. The American Heart Association estimates that in the United States alone, PM2.5 air pollution spark some 60,000 deaths a year.
Even if the air looks clear, it’s nearly certain you’ve inhaled millions of PM2.5 particles. Though often invisible to humans, such particles are present everywhere in Earth’s atmosphere, and they come from both natural and human sources. Wind, for example, lifts large amounts of mineral dust aloft in the Arabian and Saharan deserts. In many heavily urbanized areas, such as eastern China and northern India, power plants and factories that burn coal lack filters and produce a steady stream of sulfate and soot particles. Motor vehicle exhaust also creates significant amounts of nitrates and other particles. Both agricultural burning and diesel engines yield dark sooty particles scientists call black carbon.
Though PM2.5 as a class of particle clearly poses health problems, researchers have had less success assigning blame to specific types of particles. One of the big sticking points: PM2.5 particles frequently mix and create hybrid particles, making it difficult for both satellite and ground-based instruments to parse out the individual effects of the particles.
Seabreeze
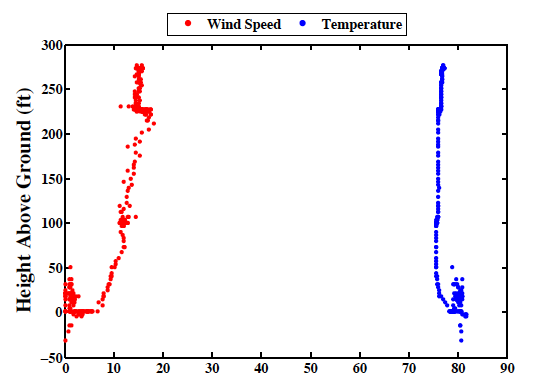 The sea breeze is a very localized phenomenon where the cooler high pressure air over the ocean moves inland towards the warmer low pressure air over the land and creates a convection. The movement of air causes a breeze coming off the water. The convection is reversed at night when the sun goes down; the land becomes cooler than the water and the high pressure air over the land moves towards the low pressure air over the ocean. The sea breeze also only occurs a small distance inland and up into the atmosphere. The following plot derived from data gathered using a Profiler shows both temperature and wind speed in relation to altitude. Once above ground level, the wind speeds gradually increase and the temperate drops and them remains somewhat constant. At around 230 feet, however, the temperature increases and the wind speed drops dramatically. The sudden change is due to the Profiler reaching the top of the sea breeze where the wind drops off and the temperature increases because the colder wind off the water is gone.
Boundary Layer
Boundary Layer
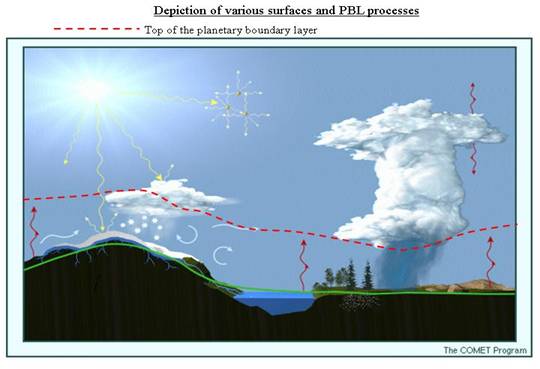
A boundary layer in broad terms is the layer of fluid in the immediate vicinity of a boundary where the effects of viscosity are significant. In atmospheric sciences, the boundary layer is the layer closest to the earth surface that is influenced by the surface itself. The atmospheric boundary layer, or ABL, is highly variable in both turbulence as well as height, it’s deeper over the desert and shallower over the ocean, as well as deeper during daylight hours. During the day, the heat rising from the Earth’s surface creates a convection, the warmer the surface temperature the taller the convention. The ABLs sensitivity to surface temperature is also why the convection is deeper over desert regions. In contrast, the addition of moisture to the convection either through evaporation or other means leads to the decrease in height of the layer. The winds of the ABL are affected in large part by surface features. When the wind is obstructed by mountains or a building it introduces random vertical and horizontal velocities that interrupt the constant flow and create turbulence. Areas with a lot of man made structures can have significantly lower winds compared with open areas over land and ocean.
Just above the ABL is a layer of warm air called the temperature conversion. The temperature conversion is unusual because typically as altitude increases temperature drops, however the temperature conversion is a region higher in altitude and warmer than the ABL. The boundary of warmer air is important in cloud formation and precipitation as well as the diffusion of air pollutants. Beyond the ABL and temperature inversion, the atmosphere is free from friction and the wind patterns change. At higher altitudes the wind speed increases, the wind direction changes, and the wind becomes geostrophic meaning it flows from areas of high pressure to low pressure.
Lapse Rate
The lapse rate is the rate of change in the temperature with altitude and is highly variable due to the influences of radiation, convection, and condensation. Lapse rate is considered positive when temperature goes down with altitude, zero when temperature is constant, and negative when temperature increases. There are different types of lapse rate. The adiabatic lapse rate is the temperature change due to the rising or sinking of air, not due to heat loss or gain to the environment surrounding it. Adiabatic lapse rate can be either dry or moist. Dry adiabatic lapse rate is determined entirely by the specific heat capacity of the air at constant pressure. The moist adiabatic lapse rate is involved when the air has moisture that condenses, the process of condensation allows the air to retain heat longer and cools more slowly than if it were dry. The moist adiabatic lapse rate is more varied because of the variability of a regions moisture levels. It’s possible for the moist air to give off enough condensation in time to become dry.
The differences between typical lapse rate and dry and moist adiabatic has great influence over the vertical stability of the atmosphere. In other words, it determines whether a parcel of air is resistant to outside forces or if it will move from its original position. This property is important for meteorologists in forecasting cloud formation, thunderstorms, and turbulence. The rate provides information as to how far a parcel of air will rise and whether it will carry water vapor high enough to form clouds, even higher to form precipitation, or high still to form thunderclouds.
Diurnal Cycle
All the forces outlined above are on a diurnal cycle, meaning they are on a 24 hour schedule. The driving force behind the diurnal cycle is the sun and the absence of the sun and the heat it provides to the earth. The most commonly studied cycle is the change in temperature. The earths surface just like any other surface has a specific capacity to absorb heat, so as the sun rises and shines light on the earth surface it slowly begins to retain heat and radiate it to the air nearest the surface. So even though the sun is directly overhead and emitting maximum power at noon, the temperature isn’t at the daily peak until afternoon when the heat from the earth’s surface transfers to the air.
There are other meteorological factors that follow a diurnal cycle. Opposite temperature, humidity is lowest in the afternoon and highest before sunrise. Winds and clouds are also on diurnal cycles. Winds tend to increase during the day and change direction in a clockwise rotation and decrease at night and reverse rotation. Similarly, clouds and precipitation tend to increase in the afternoon and decrease at night, however, the opposite is true over the large bodies of water.
Engineering
3D Design and Modeling
Engineering is an important part in designing both the kite and the aeropods themselves.
When designing kites there are a lot of components that come into play, primarily aerodynamic forces. A kite’s aerodynamics are influenced by a variety of factors including weight, dimensions, curvature, etc. There are several different kites that can be built from home to become acquinted with the forces that act onsite flight. It’s possible to construct low cost and functional kites using a sewing machine and tyvek material. Similarly, one could make miniatures kites using tissue paper that fly as well as larger kites but with a much smaller wind velocity that can be generated just by waving an arm back and forth. The benefit of building a kite from scratch is affordability as well as being able to customize and alter the kite for better performance.
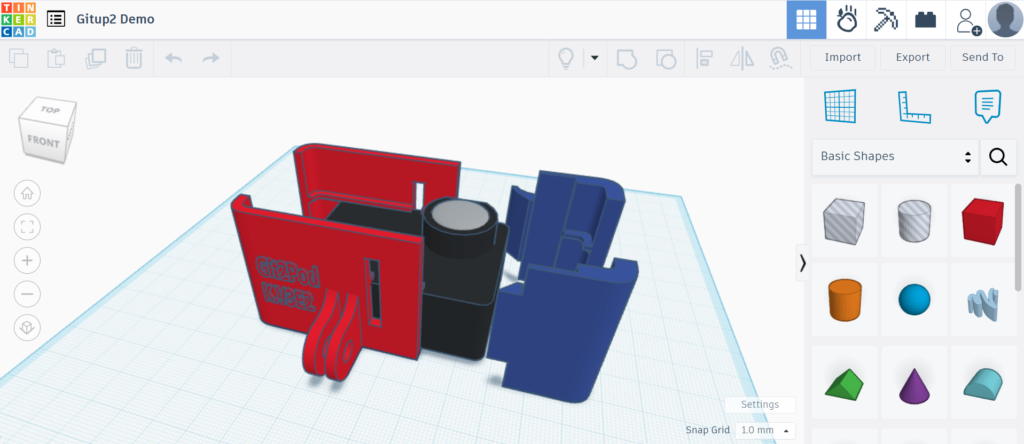
The aeropod is designed to carry instrumentation and fly stably beneath a kite. On the front end is the mount for the instrument that both holds the instrument in place and protects it in case the aeropod falls. On the back end are perpendicular fins that keep the aeropod directionally oriented with the wind as well as dampens the sway introduced by the wind. Lastly, in the middle of the aeropod is a pylon. The pylon is an adjustable part that is located at the center of gravity so that the kite hangs in balance and is more stable during flight.
3D Printing
A 3D printer is a machine that draws in plastic filament and heats it so the its malleable and then lays down the filament in a pattern dictated by a 3D modeled file. In using a 3D printer, a students would be exposed to a variety of engineering concepts from the mechanics of the 3D printer to the design and testing of the 3D modeled parts. When designing aeropod parts the primary concerns are weight, strength, and ease of printing. A successful 3D part is strong and as light weight as possible, it needs to be able to withstand the force of the aeropod falling out of the air, as well as be light enough for the kite to lift relatively easily. It’s also important to design the parts with other people in mind. Not everyone’s 3D printers are the same type or quality and for everyone to be able to print an aeropod, the parts have to be easy to print with minimal changes to printer settings.To design 3D parts we primarily use the software TinkerCAD that is free and accessible through a web browser. TinkerCAD provides user friendly exposure to a 3D designing environment to introduce people to the idea of engineering design.. Overhang… printer settings.
Instrument Testing
Instrument testing is an integral part of the project as procurement availability and research interests change. During the testing process, there are various factors taken into account to determine if the instrument is ideal for the project, such as cost, accessibility, user-friendliness, and precision of measurements. A common test is to operate new instruments alongside current instruments to get a side by side comparison of the data quality to determine if that quality is good for the price point. Similarly, it’s important to verify that the instrument is user friendly and can be used by many levels of tech users or that the intricacies of the instrument can be laid out procedurally. Testing is a never ending part of the project as new instruments become available and others are discontinued.


History + Art
History
The National Air and Space Museum has created a comprehensive account of the history of aerial photography on their website at the link below:
https://airandspace.si.edu/stories/editorial/beginnings-and-basics-aerial-photography
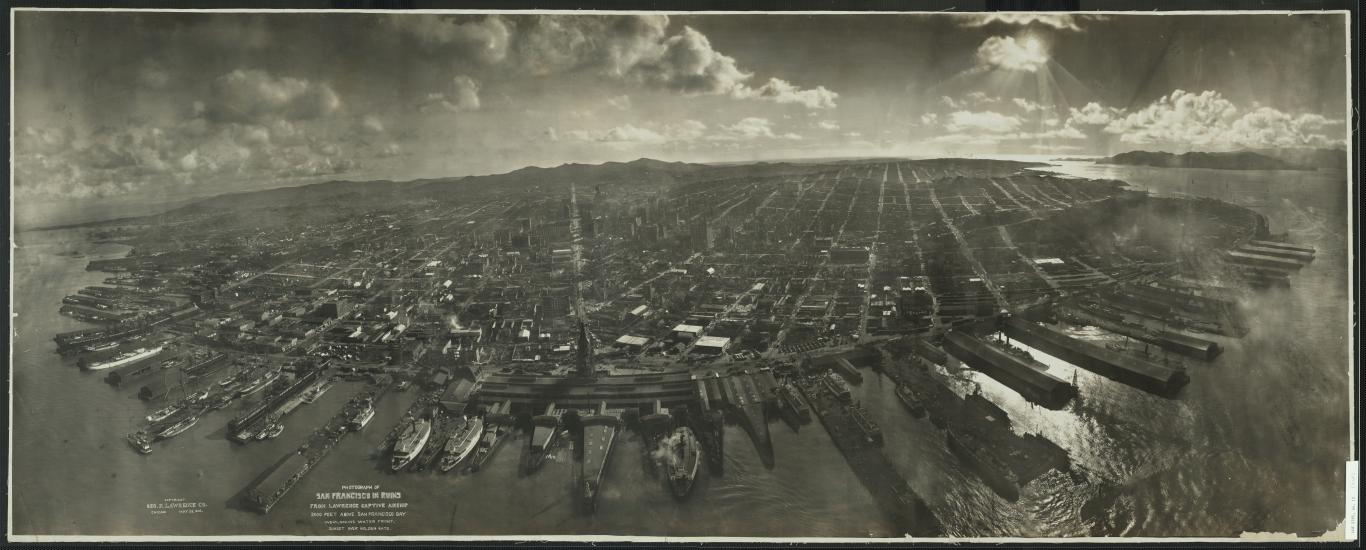 An early example of kite aerial photography of San Francisco in 1906 (Library of Congress)
Culture
Kites have been flown for centuries across the world for more than just recreational fun, they’ve been flown historically as a way to send messages across long distances, as a symbol of strength and prosperity, a connection to spirits and ancestors, and many more. Some of the extensive cultural history of kites is covered in two articles linked below:
https://wokipi-kite.com/Decouverte/kite.html
https://iancollmceachern.com/single-post/exploring-the-cultural-significance-of-kites
Art
There is a vibrant and passionate community around kites as art. These communities spend hundreds of hours created kites for the sole purpose of beauty and they share these kites at competitions and kite meet-ups. Below are some examples of people and organizations that have dedicated their crafting skills to creating flyable works of art.
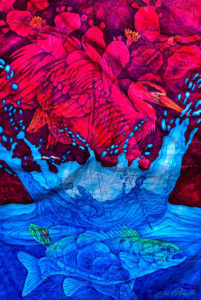 “Water is Life” by John Pollock
 Kite by Steve Brockett
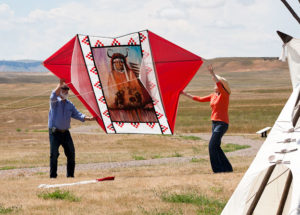 Daniel Long Soldier (Oglala Lakota) – launching “Over the Edge”
 Kite by Malcolm Goodman
 Kite by Gerard Clement
 Kite by Holger Lendla
 Kites by Michel Solin
 Kite by Jayne Edwards