Aerodynamics

Winds and Turbulence

Kite Geometries

Remote Sensing Big Ideas

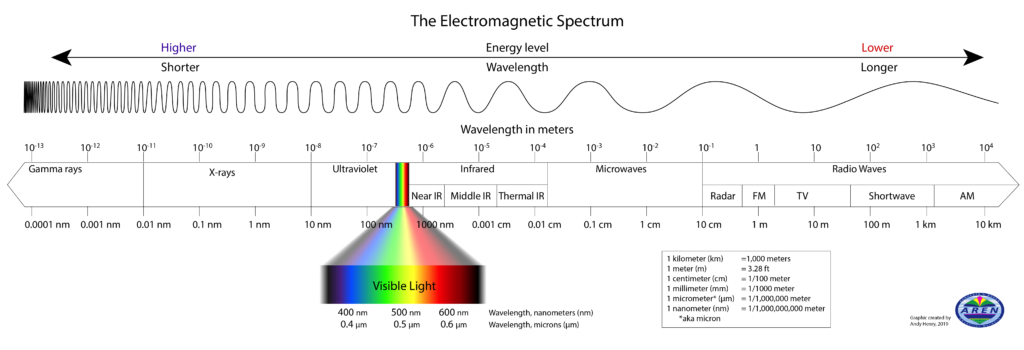
Electromagnetic Spectrum

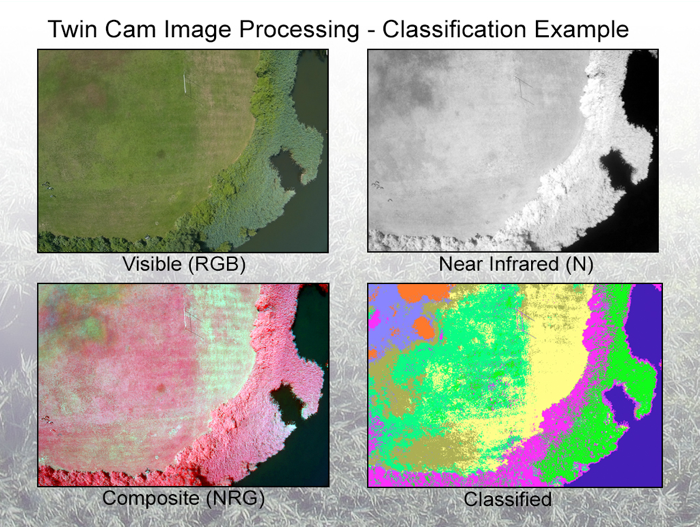
Image Classification

Vegetation Indexing

Agriculture

Invasive Species

Concepts and Phenomenon

Atmospheric Monitoring

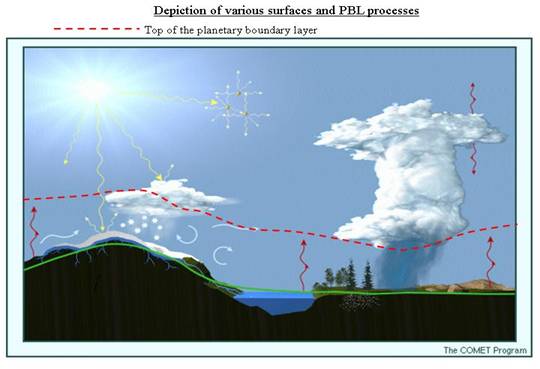
Boundary Layer
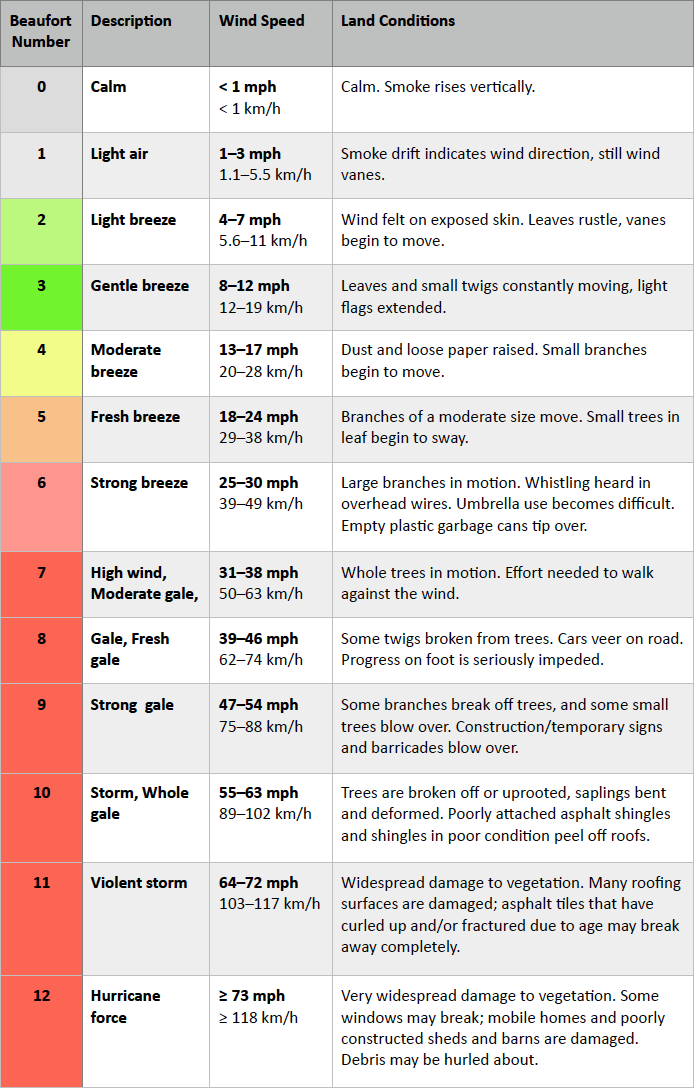
Wind is the flow of air on a large scale caused by differences in atmospheric pressure. It’s characterized in meteorology by velocity and density. When a difference in atmospheric pressure exists, air moves from the higher to the lower pressure area, resulting in winds of various speeds. Wind occurs on a range of scales, from thunderstorm flows lasting tens of minutes, to local breezes generated by heating of land surfaces and lasting a few hours, to global winds resulting from the difference in absorption of solar energy between the climate zones on Earth. The two main causes of large-scale atmospheric circulation are the differential heating between the equator and the poles, and the rotation of the planet (Coriolis effect). One way to characterize wind speeds is with the Beaufort Scale that associates wind ranges with the effect on the local land condition.
Air turbulence is when bodies of air moving at widely different speeds meet and there are several different phenomenon that cause it. Mechanical turbulence is cause when friction between the air and the ground, especially irregular terrain and man-made obstacles, cause eddies. The intensity of this eddy motion depends on the strength of the surface wind, the nature of the surface and the stability of the air. The stronger the wind speed, the rougher the terrain and the more unstable the air, the greater the turbulence. In strong winds, even hangars and large buildings cause eddies that can be carried some distance downwind.Appropriate wind conditions are crucial for successful kite flying. Most kites come labeled with an ideal wind range that is safe and appropriate for that specific kite. Flying in speeds under the ideal wind range means the kite will not be able to generate enough lift to fly, and above the wind range the kite will fly erratically and can become dangerous to the flyer.
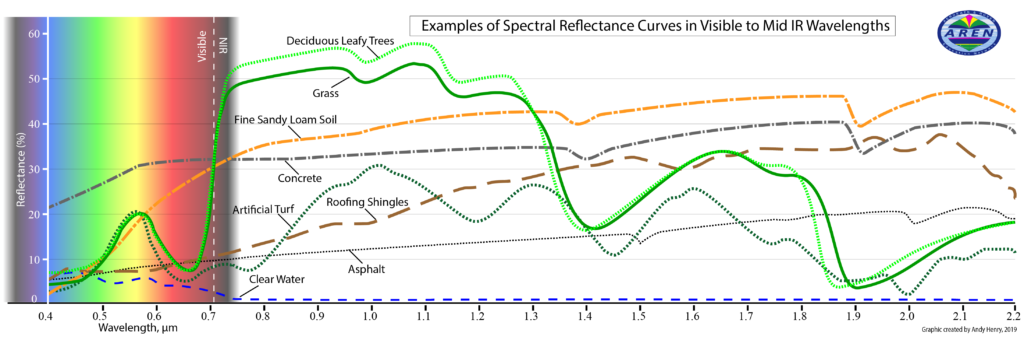
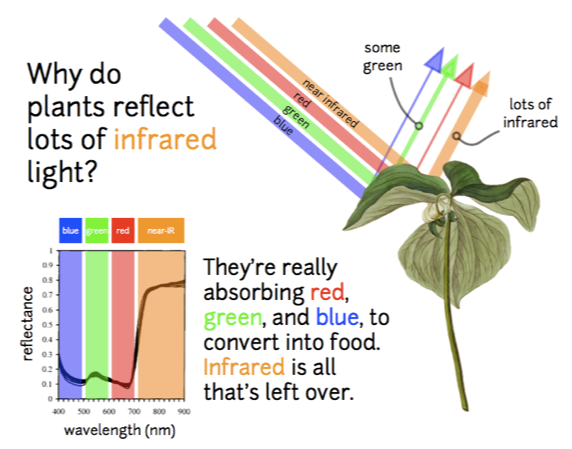 One way this is applied is in the study of plants. During photosynthesis, plants absorb and reflect colors in different quantities. Red and blue are mostly absorbed and used in food production, whereas the green is only partially absorbed and almost no near-IR light is absorbed. The higher reflectance of green compared to blue and red is why plants appear green to the human eye. Similarly, because near-IR is almost entirely reflected by vegetation, plants appear bright white when viewed through an infrared filter. This phenomenon makes it possible to observe and study plants using near-IR cameras like the ones on the TwinCam Aeropod.

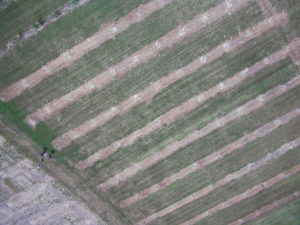 In recent years, the field of agriculture has begun to take advantage of remote sensing technology to increase crop yields with a practice known as precision agriculture. Precision agriculture is the application of precise amounts of water, fertilizer, pesticides, etc. at the correct time to the crop for increasing its productivity and maximizing its yields. NDVI is one metric that is utilized as a means of accessing crop health and help pinpoint areas that require extra watering or nutrients. The aerial perspective in agriculture is useful in a variety of other ways, in particular, for larger farms. Remote sensing allows farmers to better calculate crop acreage, identification of pests and disease infestation, crop yield predictions, flood mapping, and soil moisture. These advancements allow for data to be capture on a larger geographic scale as well as a smaller time scale so that changes can be made to improve the current crop. The data is also valuable for maintaining a high quality farm record as well as improving future decision making.
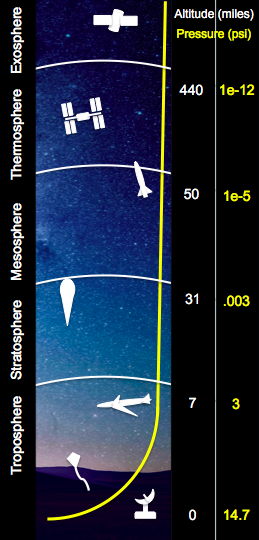 The Earth’s atmosphere is an extremely thin sheet of air extending from the surface of the Earth to the edge of space. The Earth is a sphere with a roughly 8000 mile diameter; the thickness of the atmosphere is about 60 miles. If the Earth were the size of a basketball, the thickness of the atmosphere could be modeled by a thin sheet of plastic wrapped around the ball!
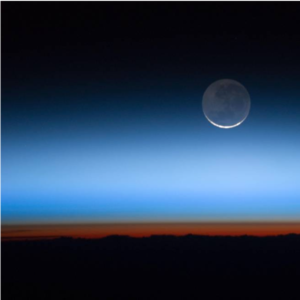
The atmosphere is divided into distinct layers. The image below captures the Thermosphere as an orange-red band over the Earth and the Stratosphere and beyond as a progression of orange to blue. The most relevant of the layers is the Troposphere because it is the closest to the Earth and holds the breathable oxygen. However, the outer layers of the atmosphere are important for other reasons. The Stratosphere houses the ozone layer which blocks the more dangerous UV-B and UV-C radiation from the sun from reaching the earth. The Mesosphere protects the Earth by burning up small objects and meteor before they can impact Earth’s surface. Similar to the Stratosphere, the Thermosphere and Ionosphere absorb harmful solar radiation like X-rays. Certain portions of the Ionosphere can also bounce radio waves back down to the Earth, allowing for long distance radio transmissions.
In addition to being closest to the Earth’s surface, the Troposphere is where weather occurs. The unequal heating of the Earth’s surface drives air and ocean circulation and causes climate to vary by latitude. Air and water circulation is initiated at the equator, where insolation is greatest. Masses of air and ocean transport heat energy from areas of high concentration to low concentration. The movement of these masses of air and ocean establish an equilibrium state of heat distribution which we determine the general climate bands, or zones that we see at different latitudes.
 Atmospheric properties are not uniform; fluid properties are constantly changing with time and location. We call this change the weather. The atmosphere’s properties and the weather it generates affect all parts of the Earth, these interactions characterize the Earth system. The Earth system behaves as a single, self-regulating closed system comprising physical, chemical, biological and human components.
At present, what is known of atmospheric science is generated from larger scale models and trends, in large part conducted on airplanes traveling hundreds of miles per hour. Because of the imprecise collection method, the science to some degree is aggregated and generalized and misses the more minute details. The goal of the AREOKATS program is to study the troposphere on a smaller scale to better understand the localized trends of climate and weather.
 Aerosols are minute particles suspended in the atmosphere. When these particles are sufficiently large, we notice their presence as they scatter and absorb sunlight. Their scattering of sunlight can reduce visibility (haze) and redden sunrises and sunsets. Aerosols interact both directly and indirectly with the Earth’s radiation budget and climate. As a direct effect, the aerosols scatter sunlight directly back into space. As an indirect effect, aerosols in the lower atmosphere can modify the size of cloud particles, changing how the clouds reflect and absorb sunlight, thereby affecting the Earth’s energy budget.
Aerosols also can act as sites for chemical reactions to take place (heterogeneous chemistry). The most significant of these reactions are those that lead to the destruction of stratospheric ozone. During winter in the polar regions, aerosols grow to form polar stratospheric clouds. The large surface areas of these cloud particles provide sites for chemical reactions to take place. These reactions lead to the formation of large amounts of reactive chlorine and, ultimately, to the destruction of ozone in the stratosphere. Evidence now exists that shows similar changes in stratospheric ozone concentrations occur after major volcanic eruptions, like Mt. Pinatubo in 1991, where tons of volcanic aerosols are blown into the atmosphere.
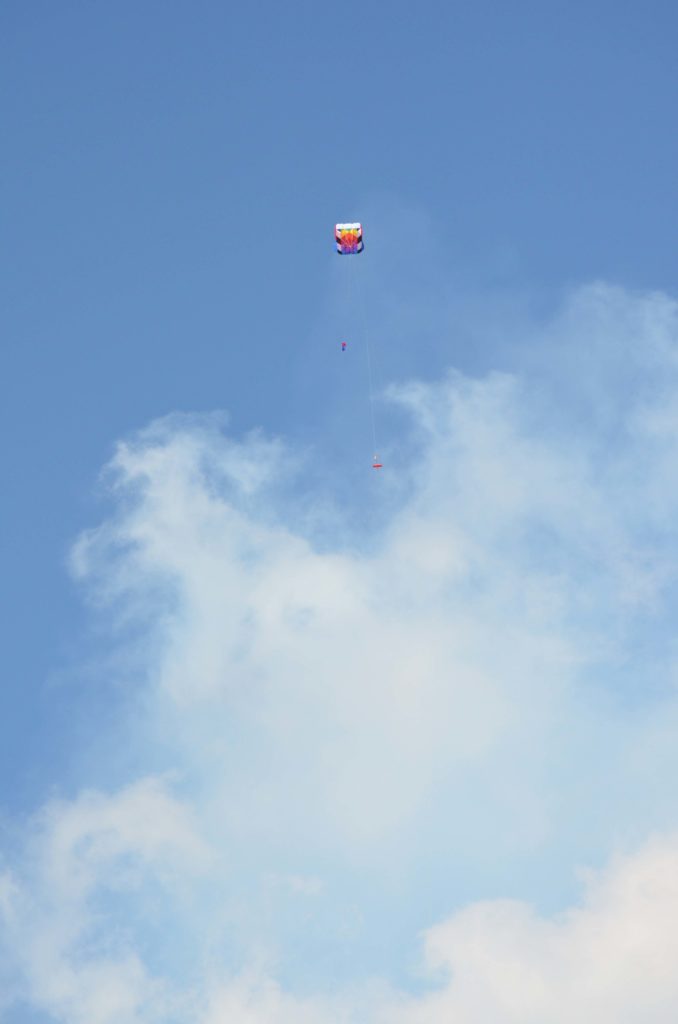
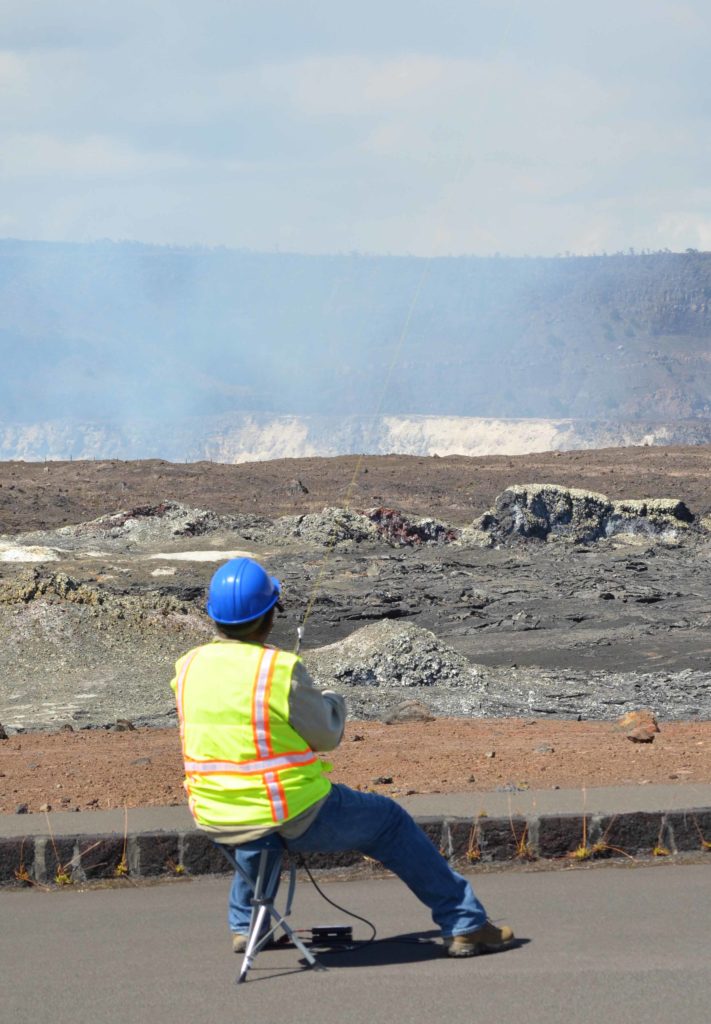
The following images are from the Verex mission over the Big Island, HI where SO2 and CO2 sensors were flown using kites near volcanic craters to measure aerosol levels and validate current volcano models.
 Three types of aerosols significantly affect the Earth’s climate. The first is the volcanic aerosol layer which forms in the stratosphere after major volcanic eruptions like Mt. Pinatubo. Winds in the stratosphere spread the aerosols until they practically cover the globe. Once formed, these aerosols stay in the stratosphere for about two years. They reflect sunlight, reducing the amount of energy reaching the lower atmosphere and the Earth’s surface, cooling them.
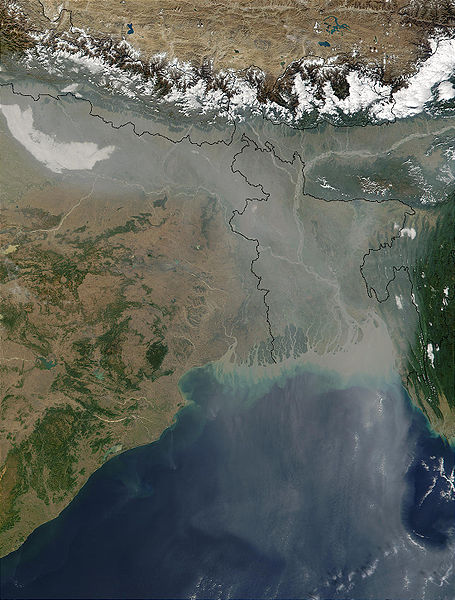
The second type of aerosol that may have a significant effect on climate is desert dust. Pictures from weather satellites often reveal dust veils streaming out over the Atlantic Ocean from the deserts of North Africa. Because the dust is composed of minerals, the particles absorb sunlight as well as scatter it. Through absorption of sunlight, the dust particles warm the layer of the atmosphere where they reside. This warmer air is believed to inhibit the formation of storm clouds. Through the suppression of storm clouds and their consequent rain, the dust veil is believed to further desert expansion.
The third type of aerosol comes from human activities. While a large fraction of human-made aerosols come in the form of smoke from burning tropical forests, the major component comes in the form of sulfate aerosols created by the burning of coal and oil. The concentration of human-made sulfate aerosols in the atmosphere has grown rapidly since the start of the industrial revolution. The sulfate aerosols absorb no sunlight but they reflect it, thereby reducing the amount of sunlight reaching the Earth’s surface. Sulfate aerosols are believed to survive in the atmosphere for about 3-5 days. The sulfate aerosols also enter clouds where they cause the number of cloud droplets to increase but make the droplet sizes smaller. The net effect is to make the clouds reflect more sunlight than they would without the presence of the sulfate aerosols.
 Particles and aerosols are closely related. Particles are microscopic solid or liquid matter in the Earth’s atmosphere, and aerosols, in contrast, are the mixture of particulate and air. Particles are most often differentiated by size, where smaller sizes are more harmful to humans. Most notably, PM10 and PM 2.5 are specific size classes of particulate with PM10 being between 10 and 2.5 micrometers and PM2.5 being 2.5 micrometers or less. Particles are considered a carcinogen and the deadliest pollution because they are able to enter a person’s lungs and blood and cause gene mutation, respiratory issues, and cardiovascular issues. The American Heart Association estimates that in the United States alone, PM2.5 air pollution spark some 60,000 deaths a year.
Even if the air looks clear, it’s nearly certain you’ve inhaled millions of PM2.5 particles. Though often invisible to humans, such particles are present everywhere in Earth’s atmosphere, and they come from both natural and human sources. Wind, for example, lifts large amounts of mineral dust aloft in the Arabian and Saharan deserts. In many heavily urbanized areas, such as eastern China and northern India, power plants and factories that burn coal lack filters and produce a steady stream of sulfate and soot particles. Motor vehicle exhaust also creates significant amounts of nitrates and other particles. Both agricultural burning and diesel engines yield dark sooty particles scientists call black carbon.
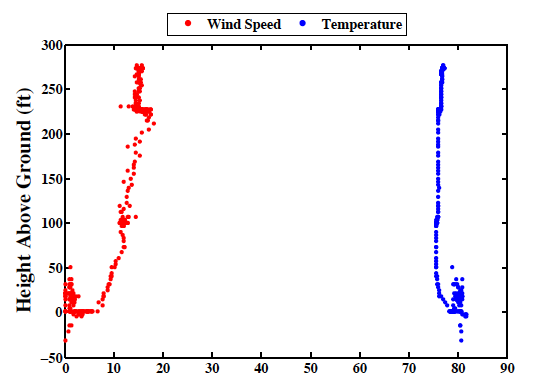 The sea breeze is a very localized phenomenon where the cooler high pressure air over the ocean moves inland towards the warmer low pressure air over the land and creates a convection. The movement of air causes a breeze coming off the water. The convection is reversed at night when the sun goes down; the land becomes cooler than the water and the high pressure air over the land moves towards the low pressure air over the ocean. The sea breeze also only occurs a small distance inland and up into the atmosphere. The following plot derived from data gathered using a Profiler shows both temperature and wind speed in relation to altitude. Once above ground level, the wind speeds gradually increase and the temperate drops and them remains somewhat constant. At around 230 feet, however, the temperature increases and the wind speed drops dramatically. The sudden change is due to the Profiler reaching the top of the sea breeze where the wind drops off and the temperature increases because the colder wind off the water is gone.